Photograph showing a row of trucks lined up next to each other

Our Solutions

Freight Infrastructure

Understand commercial freight vehicle movement within and across regions

Abstract image showing blue, white and yellow lights

Challenge

As nationwide commercial trucking grows, you need to fully understand how commercial vehicles are influencing your region or state —from how different freight vehicle types are using corridors, how they affect highway traffic and their impact on cities when executing last-mile deliveries.

Yet many DoTs haven’t had access to a large and rich commercial vehicle dataset that can build a clear picture of these behaviors. Without this information, freight vehicles will continue to make suboptimal journeys and compound local and statewide inefficiencies.

Aerial photograph of trucks in the parking lot of a distribution warehouse

Why it matters

Commercial vehicles connect goods and consumers across the U.S. – the better DOTs, MPOs and regions can characterize these journeys, the faster commerce flows across the country.

Efficient roadways and optimized connections between states, cities and regions can lead to greater economic development, more reliable safety and reduced congestion and pollution. And the better you understand freight vehicle behavior, the faster you can respond to present and future changes to your commercial freight network.

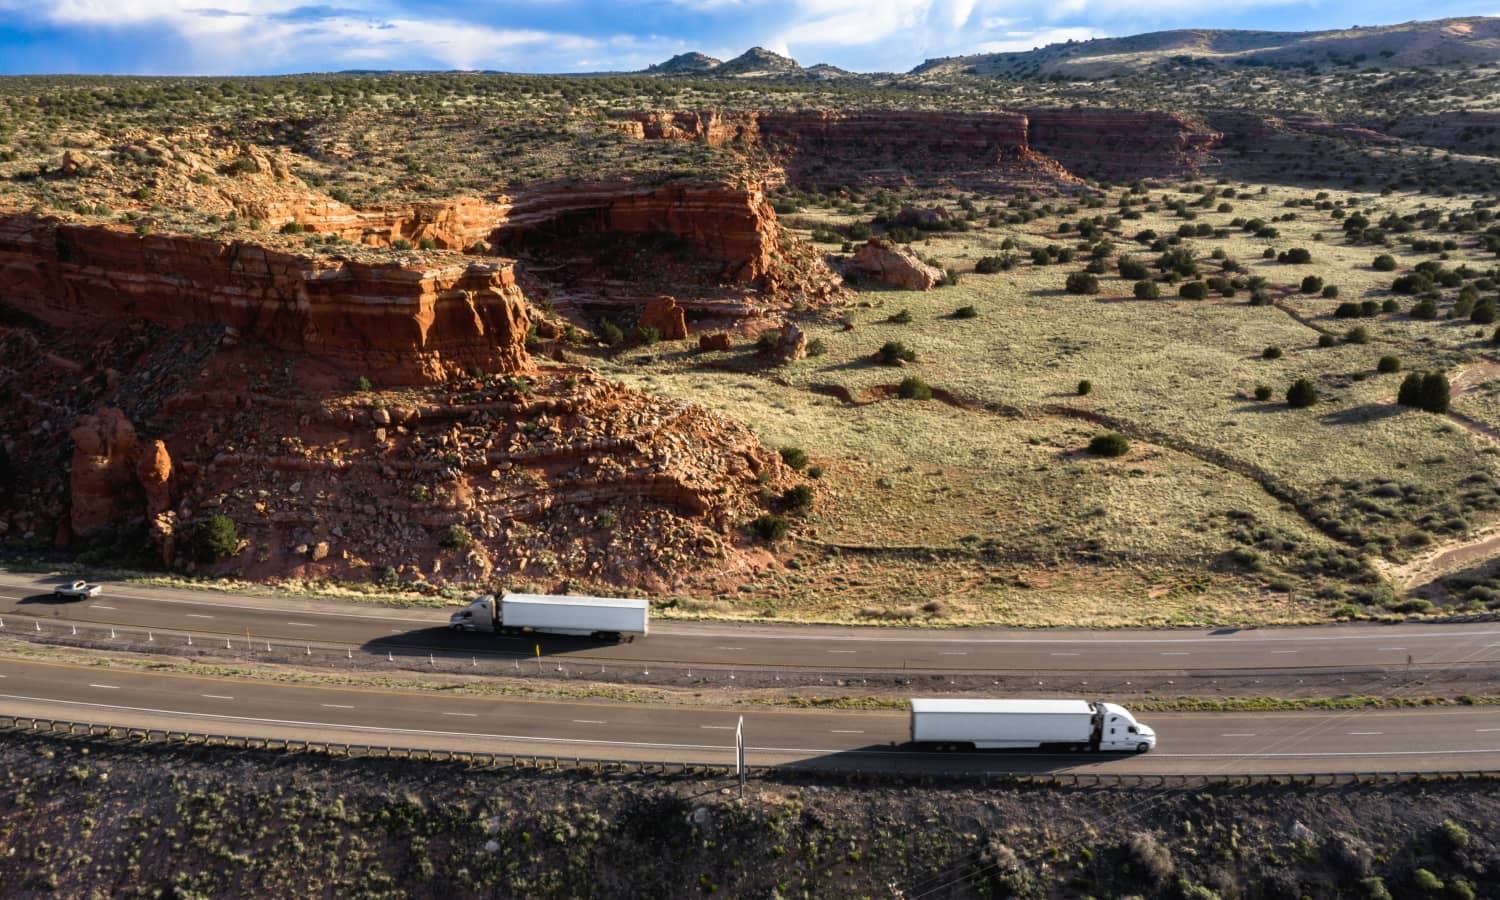
Aerial photograph of trucks and cars on a highway

How Altitude helps

You can use Altitude to find and visualize the key metrics behind freight movement, trips and bottlenecks – then use its contextualized vehicle data analytics to address common issues.

Aerial photograph of a large number of cars in a parking lot
the product interface for Geotab's Intersections product

Discover our freight infrastructure solutions

1. Freight Movement

Make informed decisions about your region’s infrastructure and freight network. Access aggregated commercial vehicle insights that can be analyzed easily and merged with existing datasets.

Break down commercial freight data by vehicle type, class and industry to establish the most common users of your transportation networks – then see how this vehicle behavior fits within the wider context of the region, and examine where they may be creating inefficiencies within the network.

Gain insight into the roads frequently traveled between origins and destinations.

Check out our Origin & Destination Product

Aerial photograph of trucks and cars on a highway

2. Route Analytics

Supplement your freight movement volume analysis with a clear and real-time picture of the routes vehicles are using to get to and from their destinations.
Check out our Origin & Destination Product

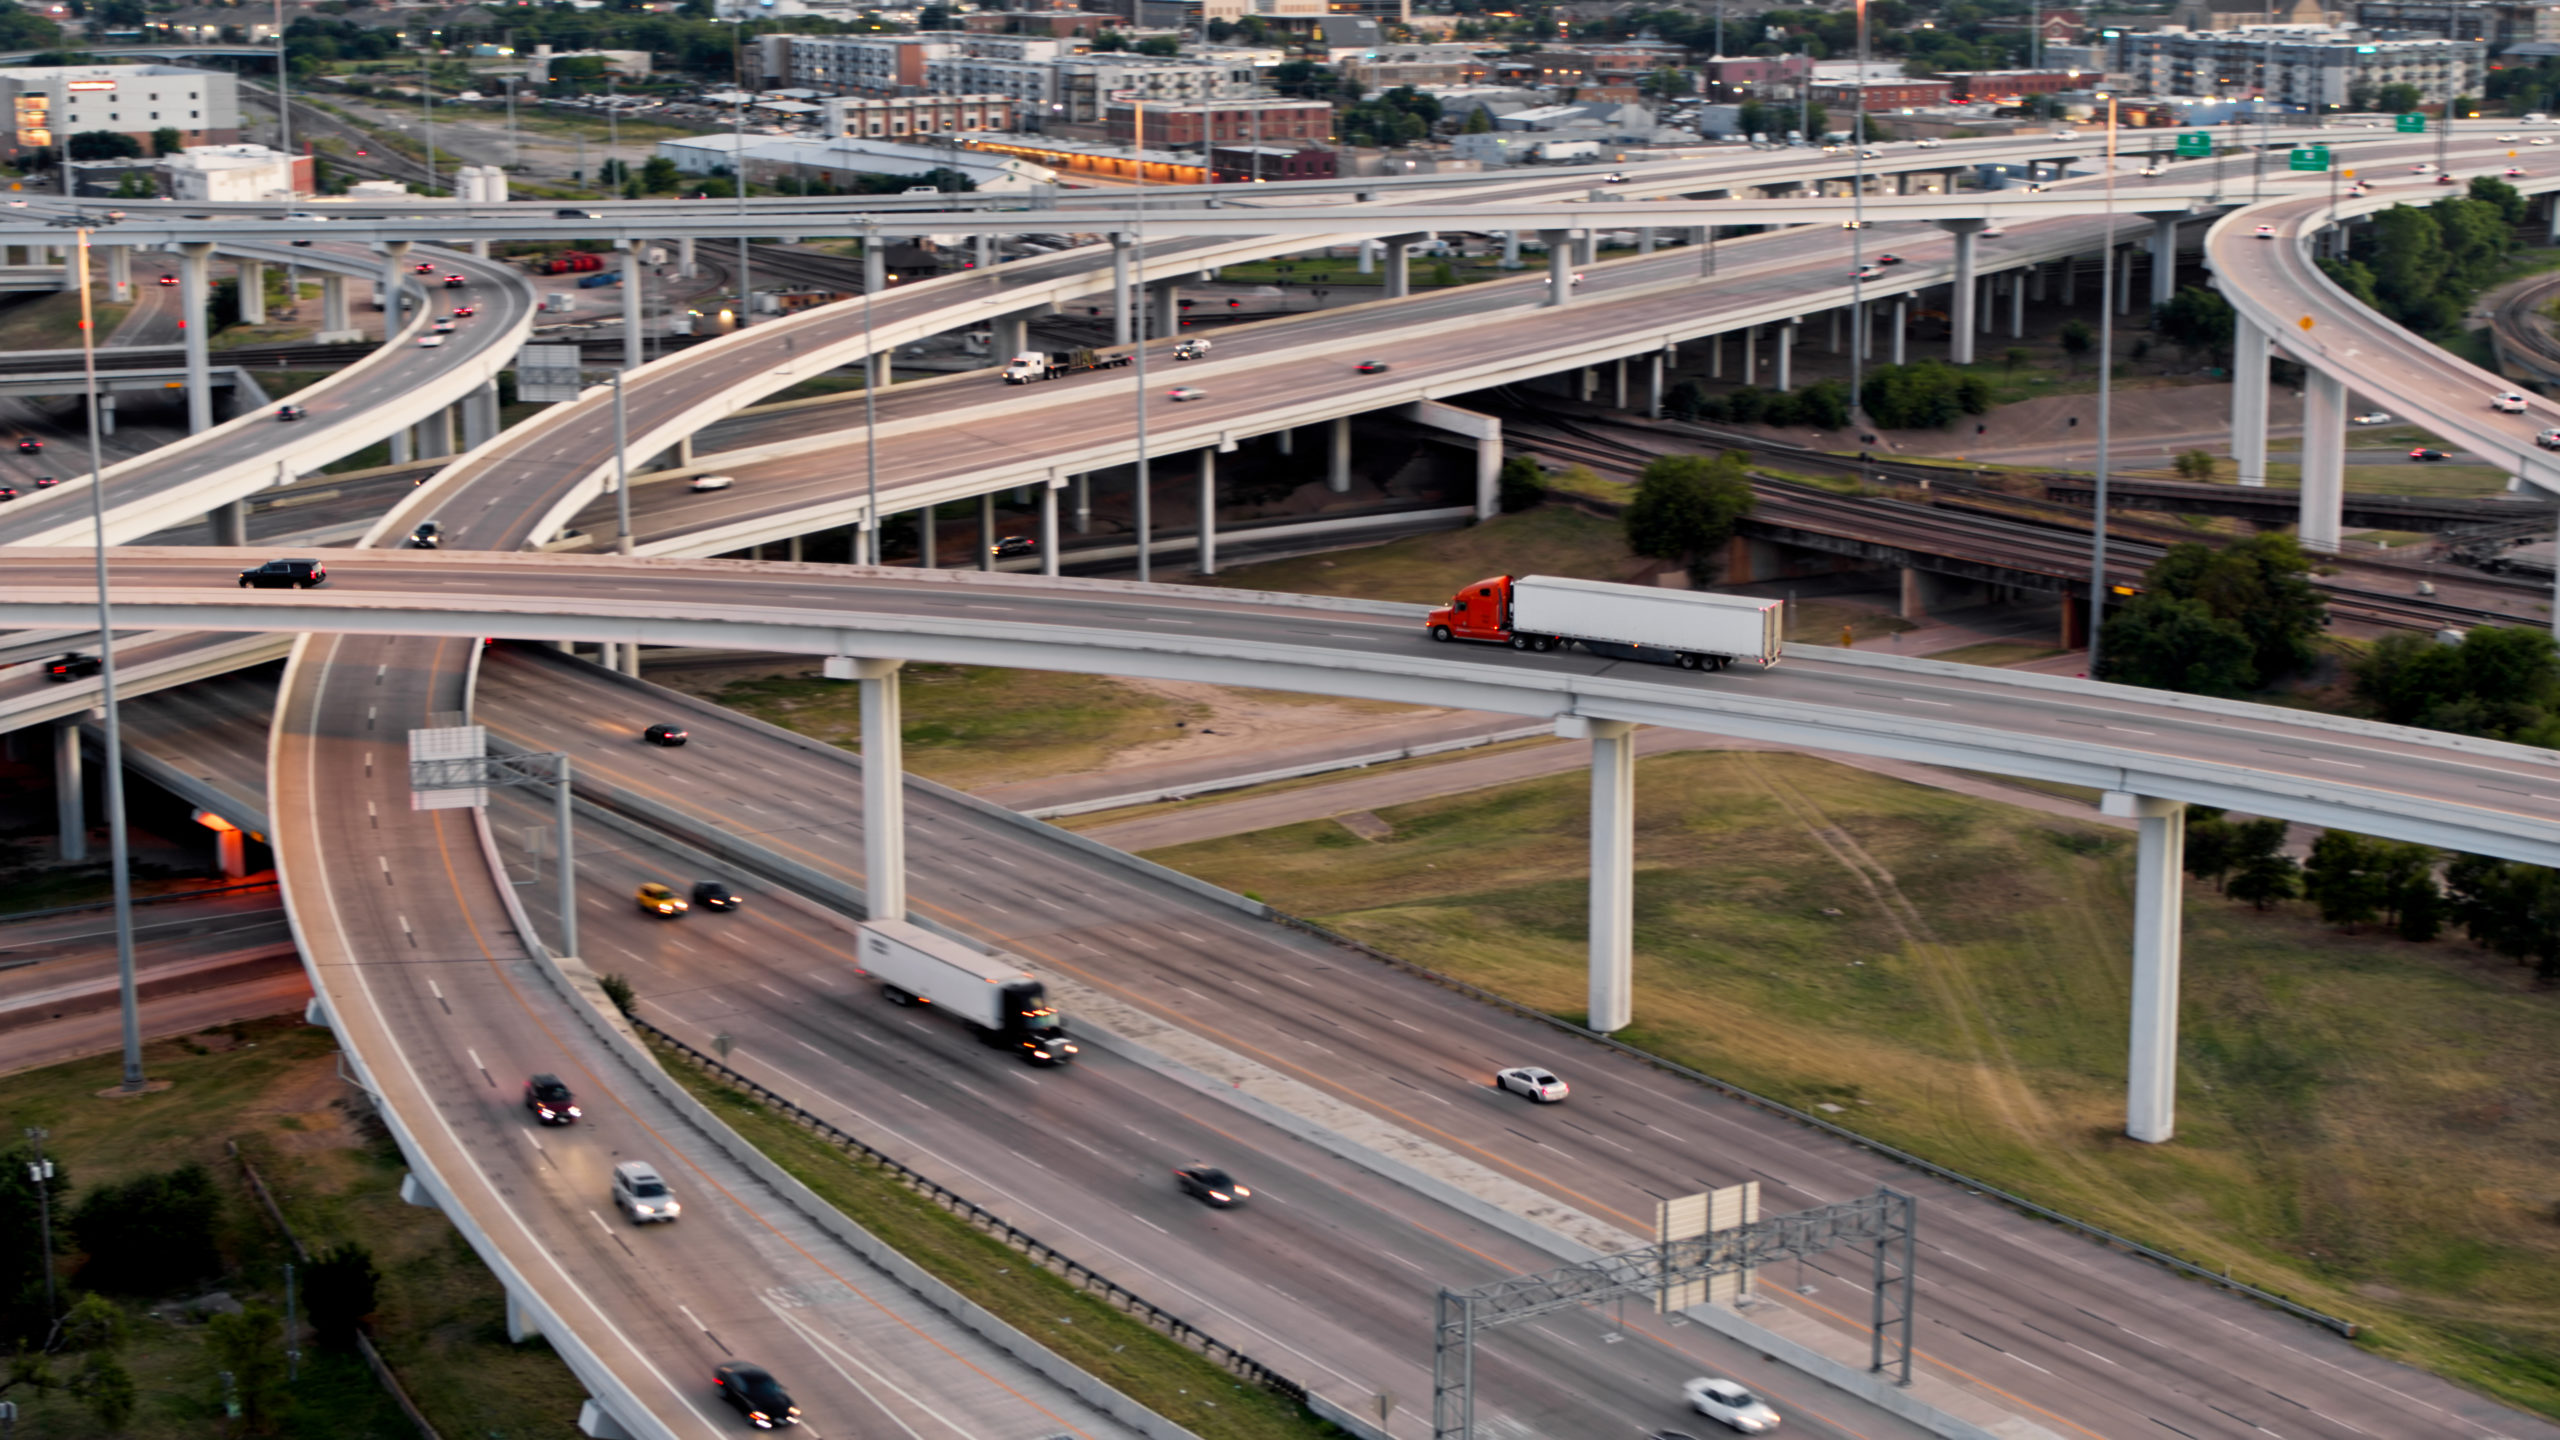
Aerial Shot of Truck on Freeway Onramp

3. Long haul parking planning

Analyze last-mile and curbside delivery activity across your region of responsibility. Then find where commercial vehicles cause high traffic density and uncover issues like bottlenecks and safety concerns caused by commercial vehicle parking.

Spot similar patterns emerging and take action before they compromise other transportation corridors.

Check out our Stop Analytics Product

Aerial photograph of trucks at a distribution warehouse

4. Freight bottlenecks

See what types of vehicles and the industries they serve are causing longer than average dwell times.

Quickly identify newly congested corridors to better understand travel times, speeds and average number of stops. Explore how vehicles interact with journey corridors, including intersections and on-ramps.

Find out where inefficiencies are causing drops in supply chain performance and suffering from bottlenecks. Address these specific areas to unblock corridors and better connect municipalities to commercial activity.
Check out our Origin & Destination Product

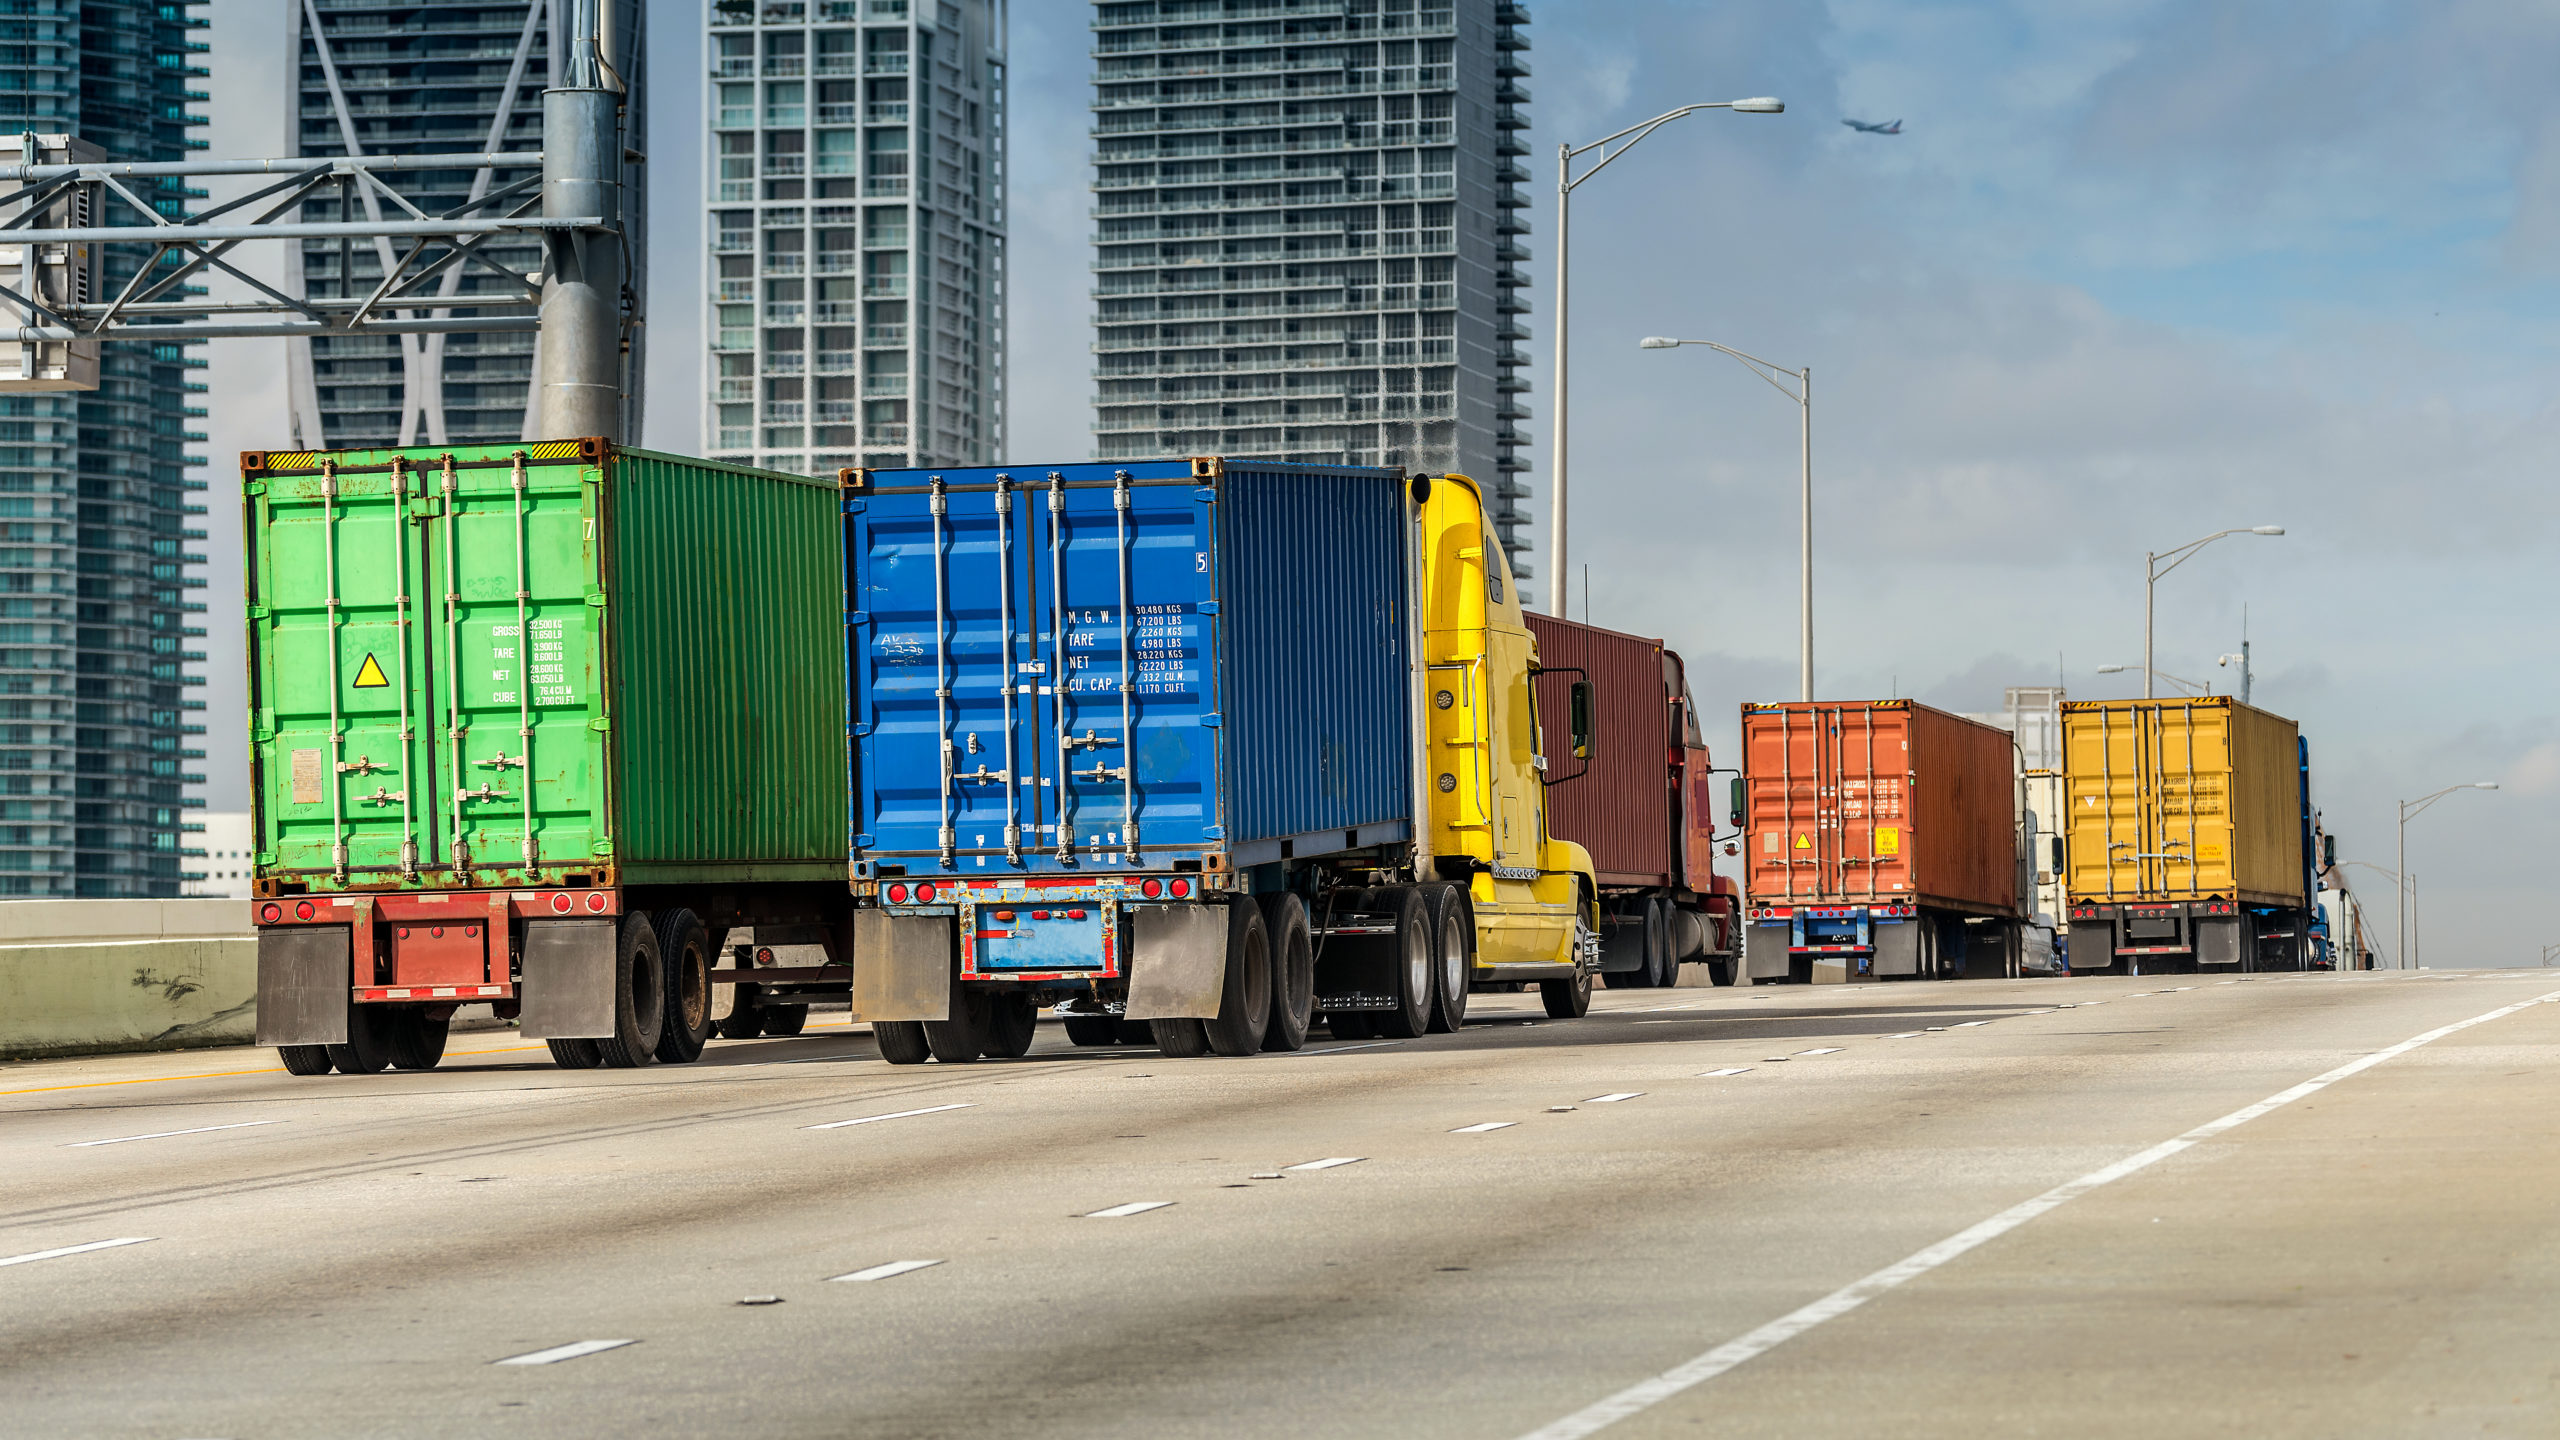
Trucks leaving the cargo area of the Port of Miami ready to deliver

Go deeper