Visualizing and measuring traffic flow from port terminals using commercial vehicle data: A Charleston, SC use case

Our transportation study of the greater Charleston region used commercial vehicle data to uncover how port terminal movement affects citywide traffic.
Geotab ITS’ recent analysis of Charleston, South Carolina demonstrates the vast potential of commercial vehicle data for assessing regional transportation networks and identifying hidden issues. Measuring overall transportation efficiency by studying key terminal movement trends, our analysis looked at how commercial motor vehicle (CMV) traffic moved to and from Wando Welch, North Charleston, Columbus Street and Union Pier. This article will detail our study’s start-to-finish process, ranging from its parameters to what the findings indicated.
Initial parameters: An overview of the commercial vehicle data analysis
The goal of our Charleston research was to contextualize the CMV movement across South Carolina’s largest city and determine the state of regional transportation as a whole. We additionally wanted to see which terminals in the area experienced the most CMV activity and where trucks were most frequently headed.
Our study used Origin & Destination data collected from nearly 80,000 different CMV devices and roughly 3,800 fleets. The transportation analytics showed that an average of 7.2 million trips were made monthly throughout the entire state of South Carolina, which amounted to about 232,000 trips per day. A total of 66 million vehicle miles were traveled by Geotab-tracked commercial or freight vehicles in our study. We estimated that these miles represented about 15% of the area’s total CMV movement.
South Carolina’s CMV data was additionally segmented by classes and vocations for extra context. These breakdowns are featured below:

By using a large sample size of data and identifying the nuances between South Carolina’s CMV classes and vocational breakdowns, we supported this study with context that would help explain its later observations.
Traffic activity observed near Charleston ports
Of the four main terminals located in the Charleston area, the further apart terminals of North Charleston and Wando Welch were seen to have the most commercial vehicle activity. Meanwhile, in comparison, the more centralized Union Pier and Columbus Street terminals were less busy. Our expansion factors allowed us to extrapolate these CMV insights across the region’s entire commercial vehicle population.

This trip count data was observed between January 1, 2024 and April 1, 2024.
CMV traffic around each terminal significantly varied by day. Monday through Thursday had the highest regular traffic totals, while Saturdays and Sundays experienced the largest decreases in movement.

This trip data was recorded between April 1 and April 7 of 2024.
After analyzing the Charleston region’s CMV travel as a whole, we got more granular with our study and focused on terminal-specific activity.
CMV activity in relation to the Wando Welch Terminal
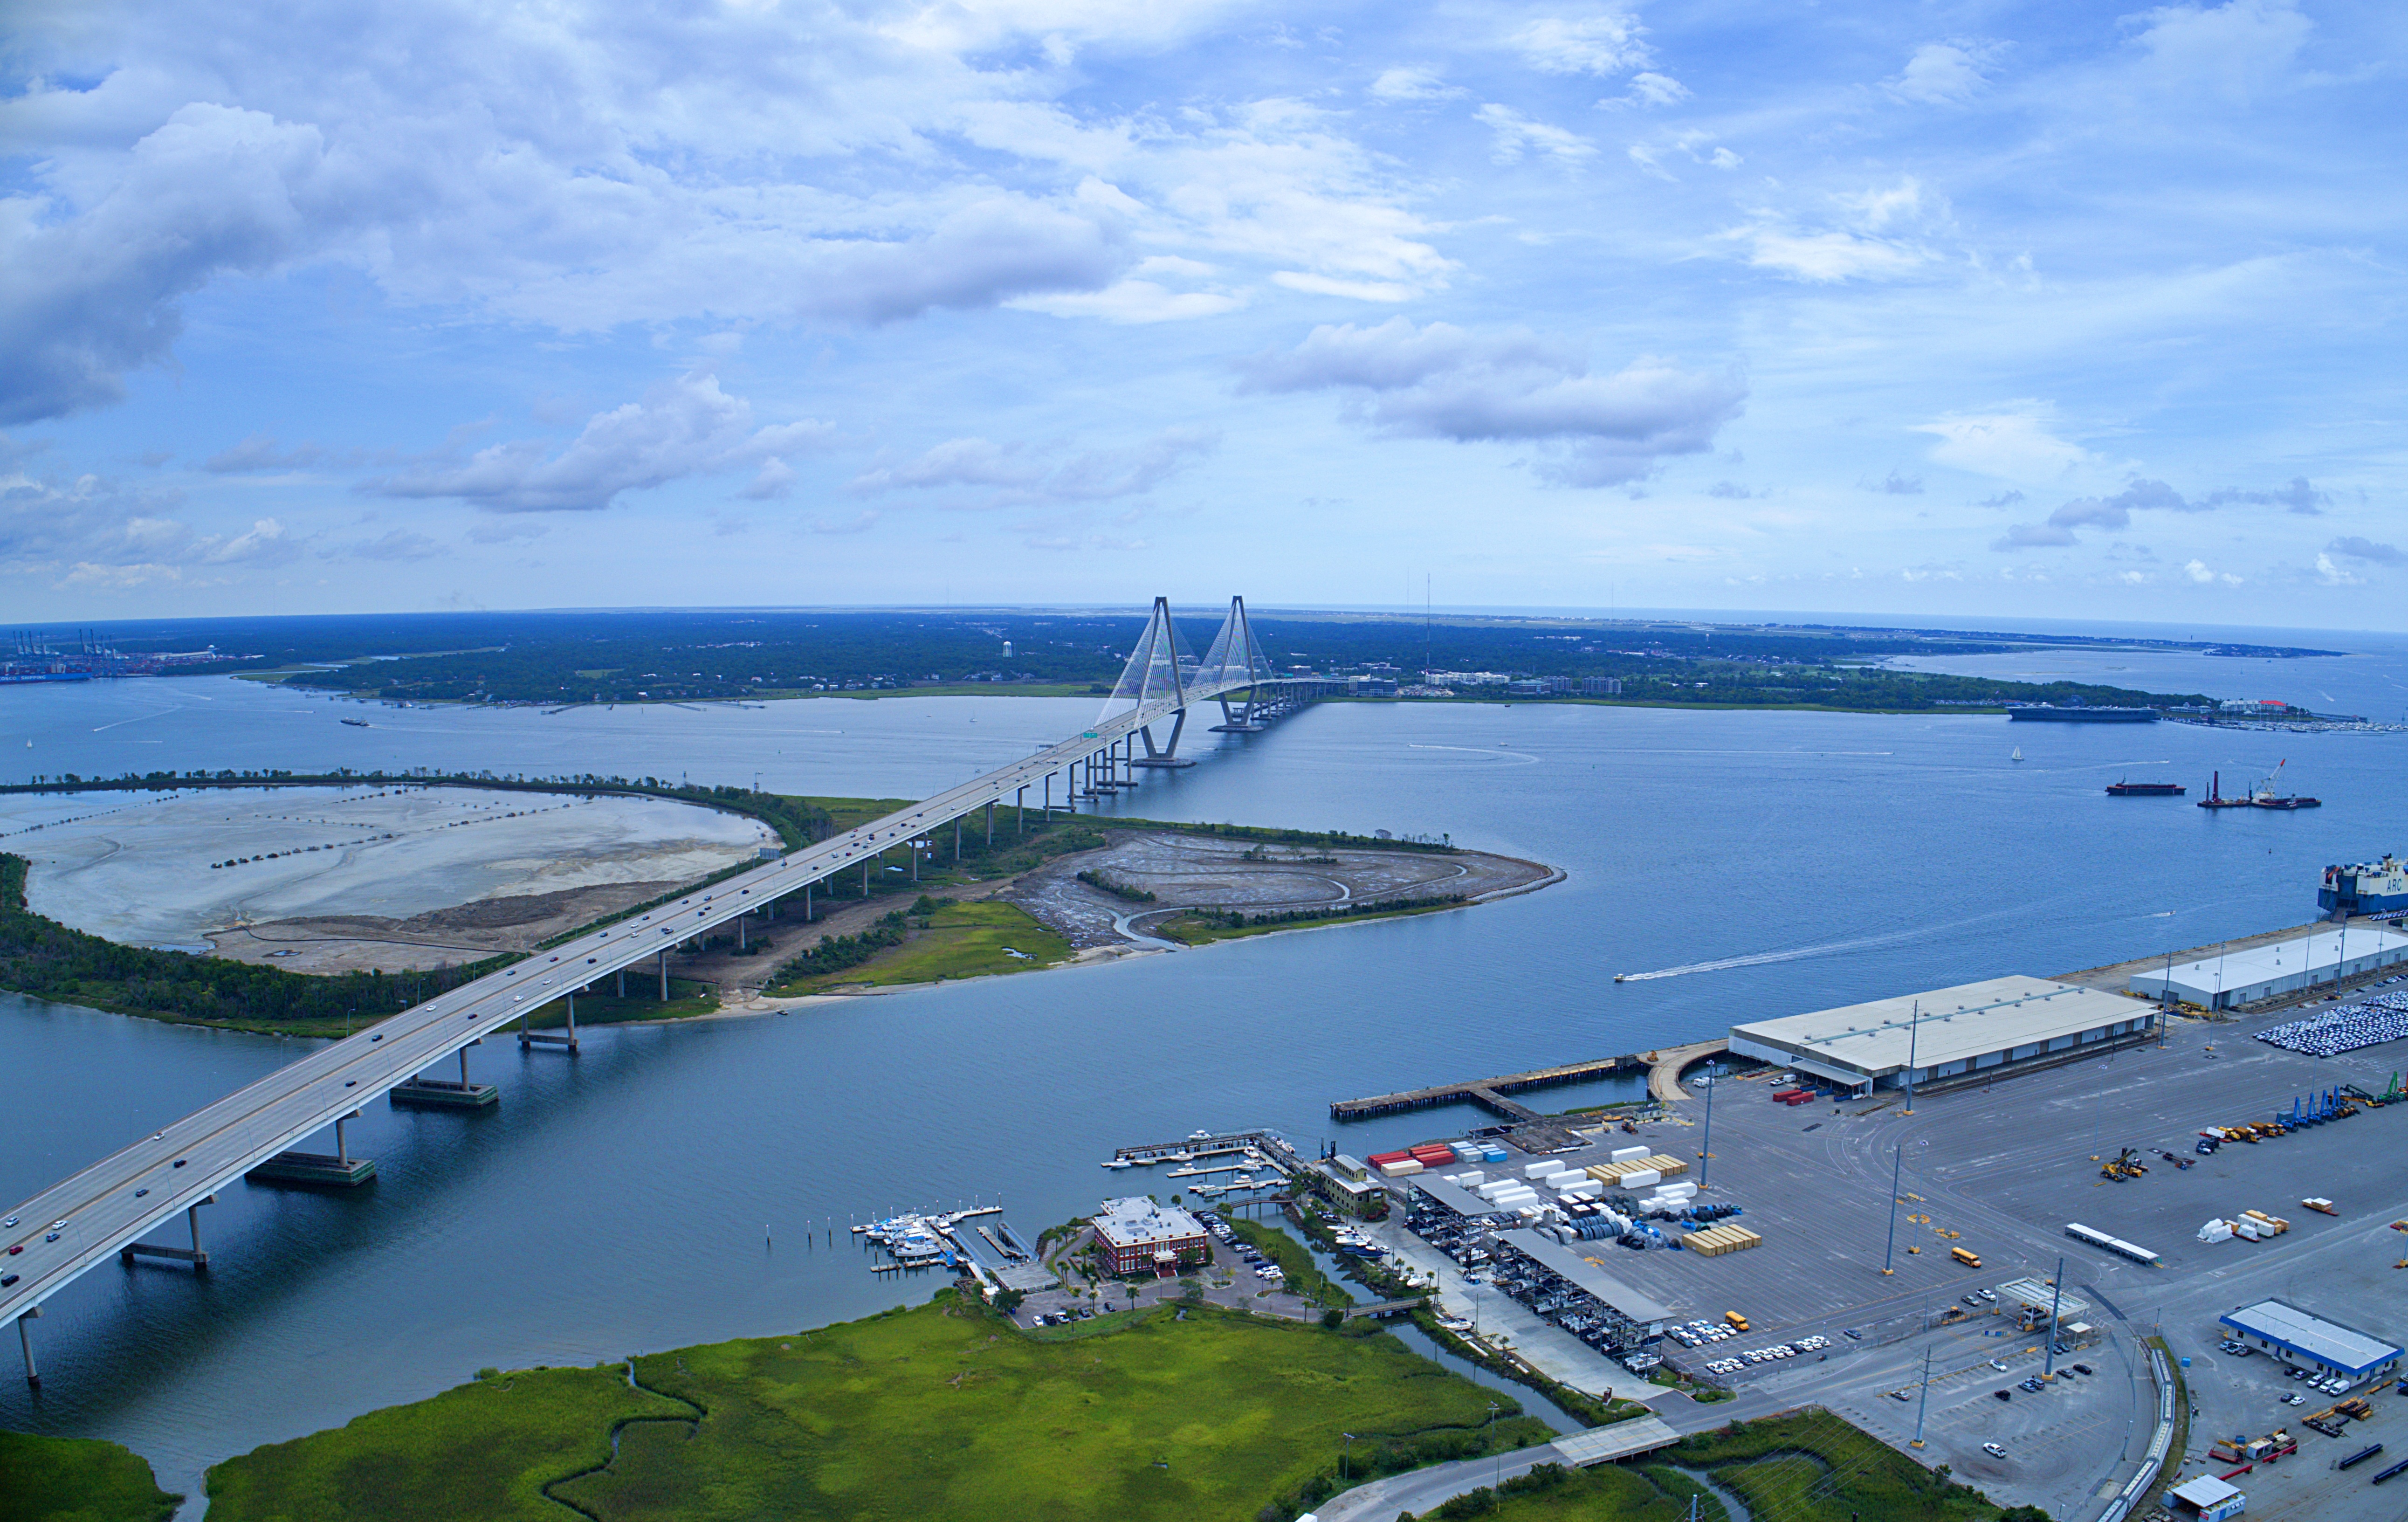
Wando Welch Terminal is located slightly northeast of downtown Charleston in Mount Pleasant, South Carolina. Our analysis observed that 91% of trips starting from this terminal would find themselves having a first stop somewhere within South Carolina.

A heatmap showing the most common destinations of journeys starting at Wando Welch. This trip data was recorded between January 1, 2024 and April 1 in 2024.
The primary departure routes from Wando Welch were observed as heading north-westbound and north-eastbound. With limited routing options headed directly to Charleston due to the Wando River, these departure roads are critical to the port authority’s commercial distribution strategy.
CMVs with Wando Welch as their destination primarily took the I-26 to U.S. Highway 17 route to get from northern Charleston to Mount Pleasant. The Wando Welch Terminal’s impact on Charleston city traffic was observed to be not as significant as that of other ports in the region, likely because the aforementioned primary routes to and from Wando Welch do not cut directly through Charleston’s downtown district.

A heatmap showing the most common roads used by vehicles heading toward Wando Welch. This data was observed between January 1, 2024 and April 1, 2024.

A breakdown of the traffic volume percentages in Charleston that were caused by CMV traffic to and from Wando Welch Terminal. This data was reported between January 1, 2024 and April 1, 2024.
Columbus Street and Union Pier Terminal CMV movement trends
Unlike Wando Welch, the Columbus Street and Union Pier terminals are both located on the Charleston peninsula. Roughly 94% of CMVs departing from these port authorities were seen to have first stops within South Carolina.

A heatmap showing the typical regions that CMVs driving from either Union Pier or Columbus Street were headed for. The data visualized is from a date range of January 1, 2024 to April 1, 2024.
When moving freight or commercial goods, vehicles leaving the ports primarily travel throughout the city of Charleston. While there are only two main routes available for Wando Welch vehicles to take, there are a wider mix of arterial routes and urban streets that Union Pier and Columbus Street CMVs can choose. This diverse selection of roadways is visualized below:

An illumination of the roads CMVs take most often to arrive at the Columbus Street or Union Pier terminals. The selected data date range is from January 1, 2024 to April 1, 2024.
It’s no surprise that due to their central locations on the eastern side of Charleston, CMV movement from these terminals has a much greater effect on overall downtown traffic patterns. CMV activity hotspots were observed near The Citadel, parallel to Bay Street (heading to and from Mazyck Wraggborough) and within the arterial routes near Meeting Street in North Charleston. Our five vehicle types also represented larger percentages of Charleston’s total traffic in this version of the model.

Traffic percentages caused by vehicles heading to and from the Union Pier and Columbus Street terminals. The insights were observed between January 1, 2024 and April 1, 2024.
Drawing conclusions from the data: CMV transportation’s overall effect on Charleston traffic
Based on the results our analysis extracted, the port authorities on the Charleston peninsula had a more significant effect on city traffic than the Wando Welch terminal across the river, despite their lower overall CMV activity. The most critical roads for CMVs traveling throughout the region were the U.S. Route 52 and U.S. Route 17.
By conducting similar studies specific to their regions, transportation planners and policymakers can visualize the traffic effects of CMV travel in their states. Comparing volume year over year, congestion patterns and travel times helps agencies measure the effects of new traffic-easing strategies they’ve championed.
Interested in learning more about how CMV data can help you strengthen your transportation planning efforts? Schedule a free demo of our Altitude platform.
You might also be interested in

BLOG
Geotab ITS at Connect 2025: Our mobility insights pitstop for transportation planners and businesses
Learn about Altitude at Geotab Connect 2025, featuring real-world use cases, hands-on workshops and a glimpse into the future of transportation planning.

BLOG
A tale of North American resilience: Unearthing the unique stories of five bridges using rich mobility insights
Our latest eBook highlights how mobility insights can help surface indicators about the resilience of five key bridges and regions in North America.

BLOG
What are contextual vehicle insights and why are they beneficial for transportation planners?
Discover why contextual vehicle insights are a must for transportation planners as they develop more effective policies and infrastructure.