Incident management use case: Harnessing transportation insights to navigate the Francis Scott Key Bridge collapse

Data-driven incident management strategies help agencies operate effectively during pivotal situations.
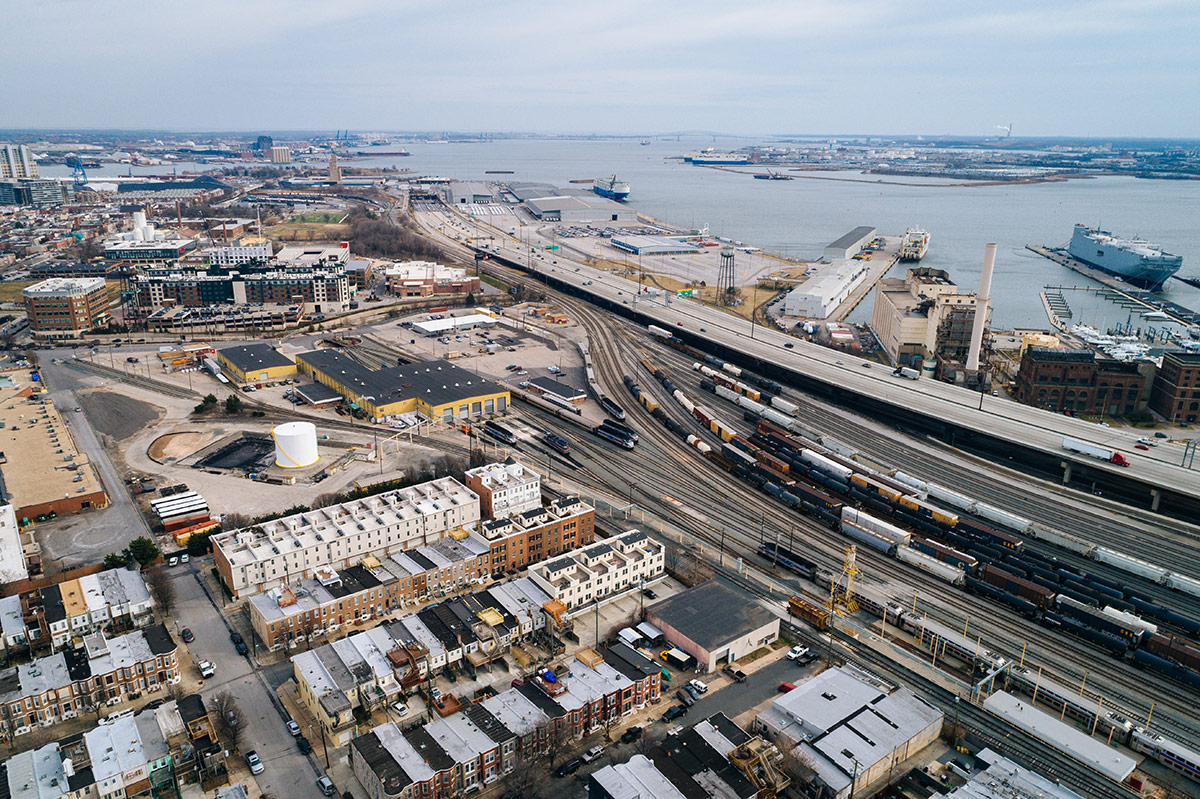
During the early morning hours of March 26, 2023 in Baltimore, Maryland, a commercial ship collided with the city’s Francis Scott Key Bridge on its way into the Brewerton Channel, causing the bridge to tragically collapse. The vessel was on course for Colombo, Sri Lanka when it suffered a loss of power as it departed from the Port of Baltimore. This loss of power rendered the ship unable to stop, resulting in the impact. Immediately following the incident, Maryland Governor Wes Moore initiated a state of emergency, supporting both federal and local crews as they tirelessly worked to search for missing persons, preserve public safety and begin the restoration process.
Impacts of an infrastructure incident on public safety, traffic and regional commerce
When a devastating incident like this happens, immediate aid helps contain public health risks and prevent further damage from occurring. Communities and first responders come together to assist those who may be injured or in danger from the fallout of the collapsed infrastructure, with a well-coordinated effort needed for success. In tandem with the safety and recovery efforts, a full analysis of the incident is conducted to better understand how to prevent similar tragedies from occurring, how traffic flows will be affected in the short-term and how adaptations must be made to limit present and future disruptions. In the case of the Francis Scott Key Bridge, it was seeing 4.2 million commercial vehicle trips across it yearly prior to its fall.
A Geotab ITS study featured in Automotive Fleet magazine demonstrated how the bridge was used prior to the incident. Our findings showed that 92% of the weekly commercial traffic volume across the Francis Scott Key was seen Monday through Friday. Wednesdays had the highest individual traffic volume at roughly 20% of the weekly total. On average, around 83,000 commercial vehicle trips were made each week across the bridge.

A bar graph from our study demonstrating the average daily commercial vehicle traffic.
Due to the effects of the Baltimore bridge collapse, the Northeastern U.S. region as a whole has multiple new challenges to navigate. From a supply chain and transportation perspective, commercial vehicle travel throughout the area is sure to be impacted by increased traffic along the other remaining routes. Public traffic throughout the city will also likely be affected until the restoration process is complete, with longer commutes probable for those traveling for non-commercial purposes. All these potential effects need to be studied and planned for to mitigate delays, logistical snafus and further safety risks.
To properly assess the effects of infrastructure incidents like this on current traffic and safety, analytics are crucial. Traffic insights and connected vehicle data can form the basis of an effective incident management strategy by helping officials understand how events are unfolding. These updated metrics enable leaders to devise new mitigation strategies and forecast potential results.
Learn more about how our data provides aid during a crisis: Check out the Incident Management use case under Traffic Operations on our Interactive Map.
The role of data in limiting disruptions and creating smart incident management strategies
After these types of events, planners and policymakers can equip themselves with connected traffic data analytics that detail the various traffic flows of routes before, during and after the incident. Studying route analytics enables officials to determine the types of vehicles most frequently traveling on certain roads. Leaders can also examine which alternate routes will likely be most affected, positioning them to create smarter congestion reduction strategies.
We conducted an initial analysis of the Baltimore port region after the disaster occurred, assessing its impact on widespread travel. Some of the initial results were highlighted in a recent FreightWaves article, corroborating similar trends the Federal Motor Safety Carrier Administration (FMCSA) noticed in their own data. Here are some of our study’s key findings thus far:
Alternative Route Effects – Our data showed that as a result of the bridge collapse, the Baltimore Harbor Tunnel and the Fort McHenry Tunnel were the two alternative routes that saw the largest traffic increases. Fort McHenry drive times increased by a range of four to 15%, while Baltimore Harbor Tunnel drive times rose by five to 24%. Prior to its collapse, the Francis Scott Key Bridge accounted for approximately 15-20% of the commercial vehicle traffic occurring on the three routes, carrying nearly double the traffic of the Baltimore Harbor Tunnel but only about one-fifth of the traffic of the Fort McHenry Tunnel.

A map of the Baltimore port region. Route 1 indicates the Francis Scott Key Bridge, Route 2 indicates the Baltimore Harbor Tunnel and Route 3 indicates the Fort McHenry Tunnel.
Vocational Comparisons – Across each route, trends were also observed regarding different types of vehicles. Prior to the incident, the Francis Scott Key Bridge was driven on more often by Local, Regional and Door-to-Door vocations, as was the Baltimore Harbor Tunnel. On the other hand, the Fort McHenry Tunnel saw more vehicles associated with Long-Haul jobs moving on it. After the collapse, most regional traffic diverted to each tunnel, with Long-Haul and Local traffic predominantly shifting to non-tunnel routes like Baltimore City and the Baltimore Beltway. One final trend observed was the equal division of Door-to-Door and Hub & Spoke vocations across both tunnel and non-tunnel routes.

A detailed breakdown of vehicle vocations on the Francis Scott Key bridge prior to its collapse.
Vehicle Class Comparisons – By class, our research found that vehicles most frequently traveling on the Francis Scott Key Bridge were heavy-duty trucks. The same observation was made along the Fort McHenry tunnel. Meanwhile, our data indicated that the Baltimore Harbor Tunnel’s commuters primarily were made up of multi-purpose vehicles (with fewer heavy-duty trucks).
This contextual information found using our Altitude platform provides crucial background information on the vehicles themselves. Context-added transportation data is valuable because it provides deeper insight into the overall reasons for regional vehicle movement, ultimately helping planners better understand vehicles’ diverse purposes and travel tendencies.
In addition to the near real-time contextualized traffic data, Altitude can also assist leaders with forecasting potential results after their new traffic management strategies are implemented. By helping planners model new strategies with connected vehicle data and evaluate possible results, they can create smarter traffic solutions that enhance efficiency.
Geotab ITS continues to monitor our data and collect new insights about the unfolding situation. Another key data category to monitor in relation to this incident is truck parking. The FMCSA is mindful of how the closure and lengthened drive times will affect commercial drivers’ parking and ability to maintain compliance. They issued an emergency declaration that provisions several exceptions and are working with the Federal Highway Administration (FHWA) to develop effective truck parking strategies in light of the incident.
With the Port of Baltimore currently being closed, it’s plausible that traffic times and congestion will continue to be adversely affected even once the port reopens. As the situation develops, Geotab ITS’ analysis will look out for new signs, report the data and highlight any new transportation issues that may arise.
Improving public safety and making cities more resilient
Keeping a keen pulse on regional transportation metrics enhances public safety and travel efficiency by allowing departments of transportation (DOTs) to monitor real-time traffic flows. If a roadway is encountering too much congestion, or if an incident occurs that could cause alternate routes to back up, being armed with real-world data makes it easier to devise more effective policy and infrastructure decisions.
Data-informed transportation infrastructure also works to enhance a region’s resiliency. Officials are empowered with critical knowledge to proactively create effective disaster mitigation plans in advance and be more prepared. This way, if an emergency situation occurs, they’re able to limit negative impacts to daily life and help their cities and regions recover faster.
Approaching incident management plans with data
When an infrastructure emergency happens, many items require urgent consideration. Tackling the incident from all angles, including ones of public safety, emergency response and travel logistics is necessary to limit disruptions and create a safer environment. At Geotab ITS, our deepest sympathy goes out to those affected by the Baltimore bridge collapse. When restoring a region’s normalcy after an incident, data can offer unparalleled value in helping officials phase operations back in gradually. This calculated approach enables a community to come back stronger than ever.
For more information about our Baltimore region study or to learn more about our intelligent transportation data, speak with one of our experts today.
You might also be interested in

BLOG
What is vehicle miles traveled data and why is it crucial for strong transportation planning efforts?
Vehicle miles traveled (VMT) data explains the entirety of vehicle movement within a given region. Read to learn more about its various uses.

BLOG
Altitude’s dynamic potential highlighted at the Contextualized Freight and Mobility Data Workshop in Atlanta
The Geotab ITS team offered valuable hands-on training at our Contextualized Freight and Mobility Data event.

BLOG
From freight data to streamlined travel: Expansion factors’ role in defining regional transportation trends
Learn more about expansion factors with Geotab ITS and how they enable organizations to enhance their transportation networks.