Driving Vision Zero forward with data

How data-driven analytics are helping to meet Vision Zero goals
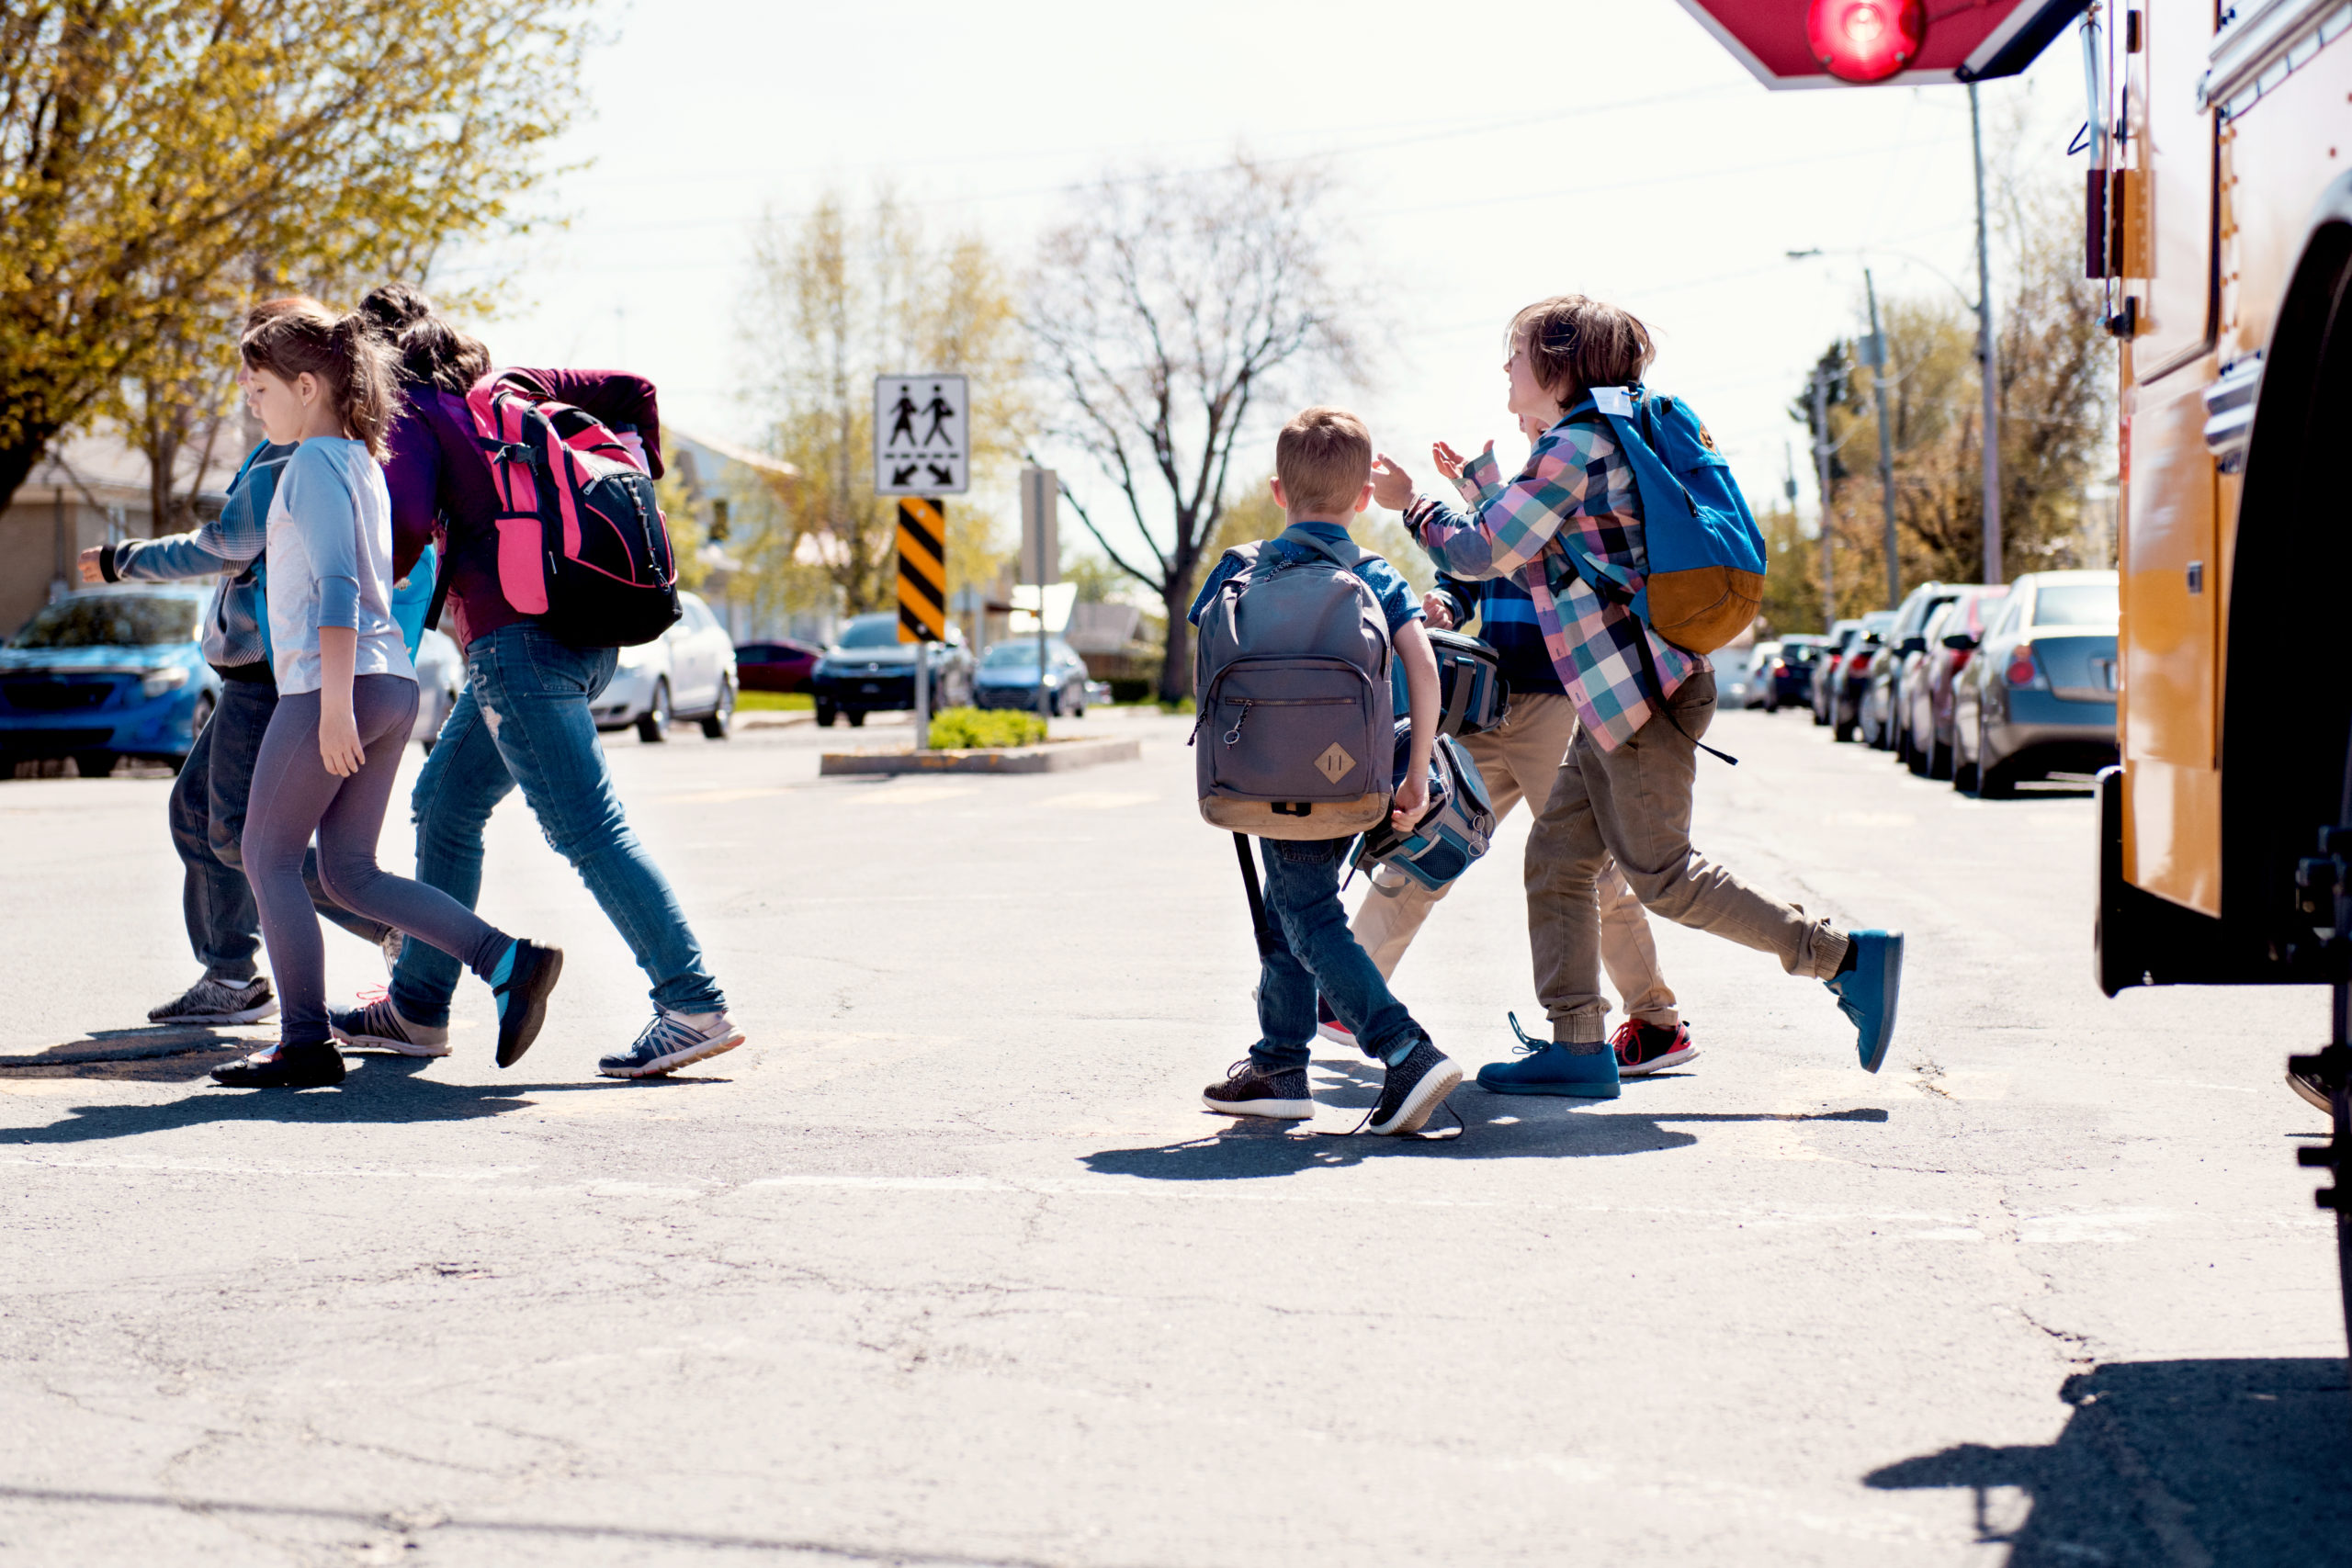
The headlines are disturbing: Globally 1.35 million people die in road crashes each year and more than half of those are among vulnerable road users like pedestrians, cyclists and motorcyclists. With the knowledge that these tragedies can be prevented, Vision Zero strategies are being implemented worldwide, prioritizing traffic and road safety to bring those fatality numbers to a halt.
Among the reasons cited for these staggering numbers are poor road infrastructure and generally unsafe road user behavior. It’s in these areas that data-driven analytics can shed light for transportation authorities to implement road safety initiatives that make an impact.
Laying the groundwork
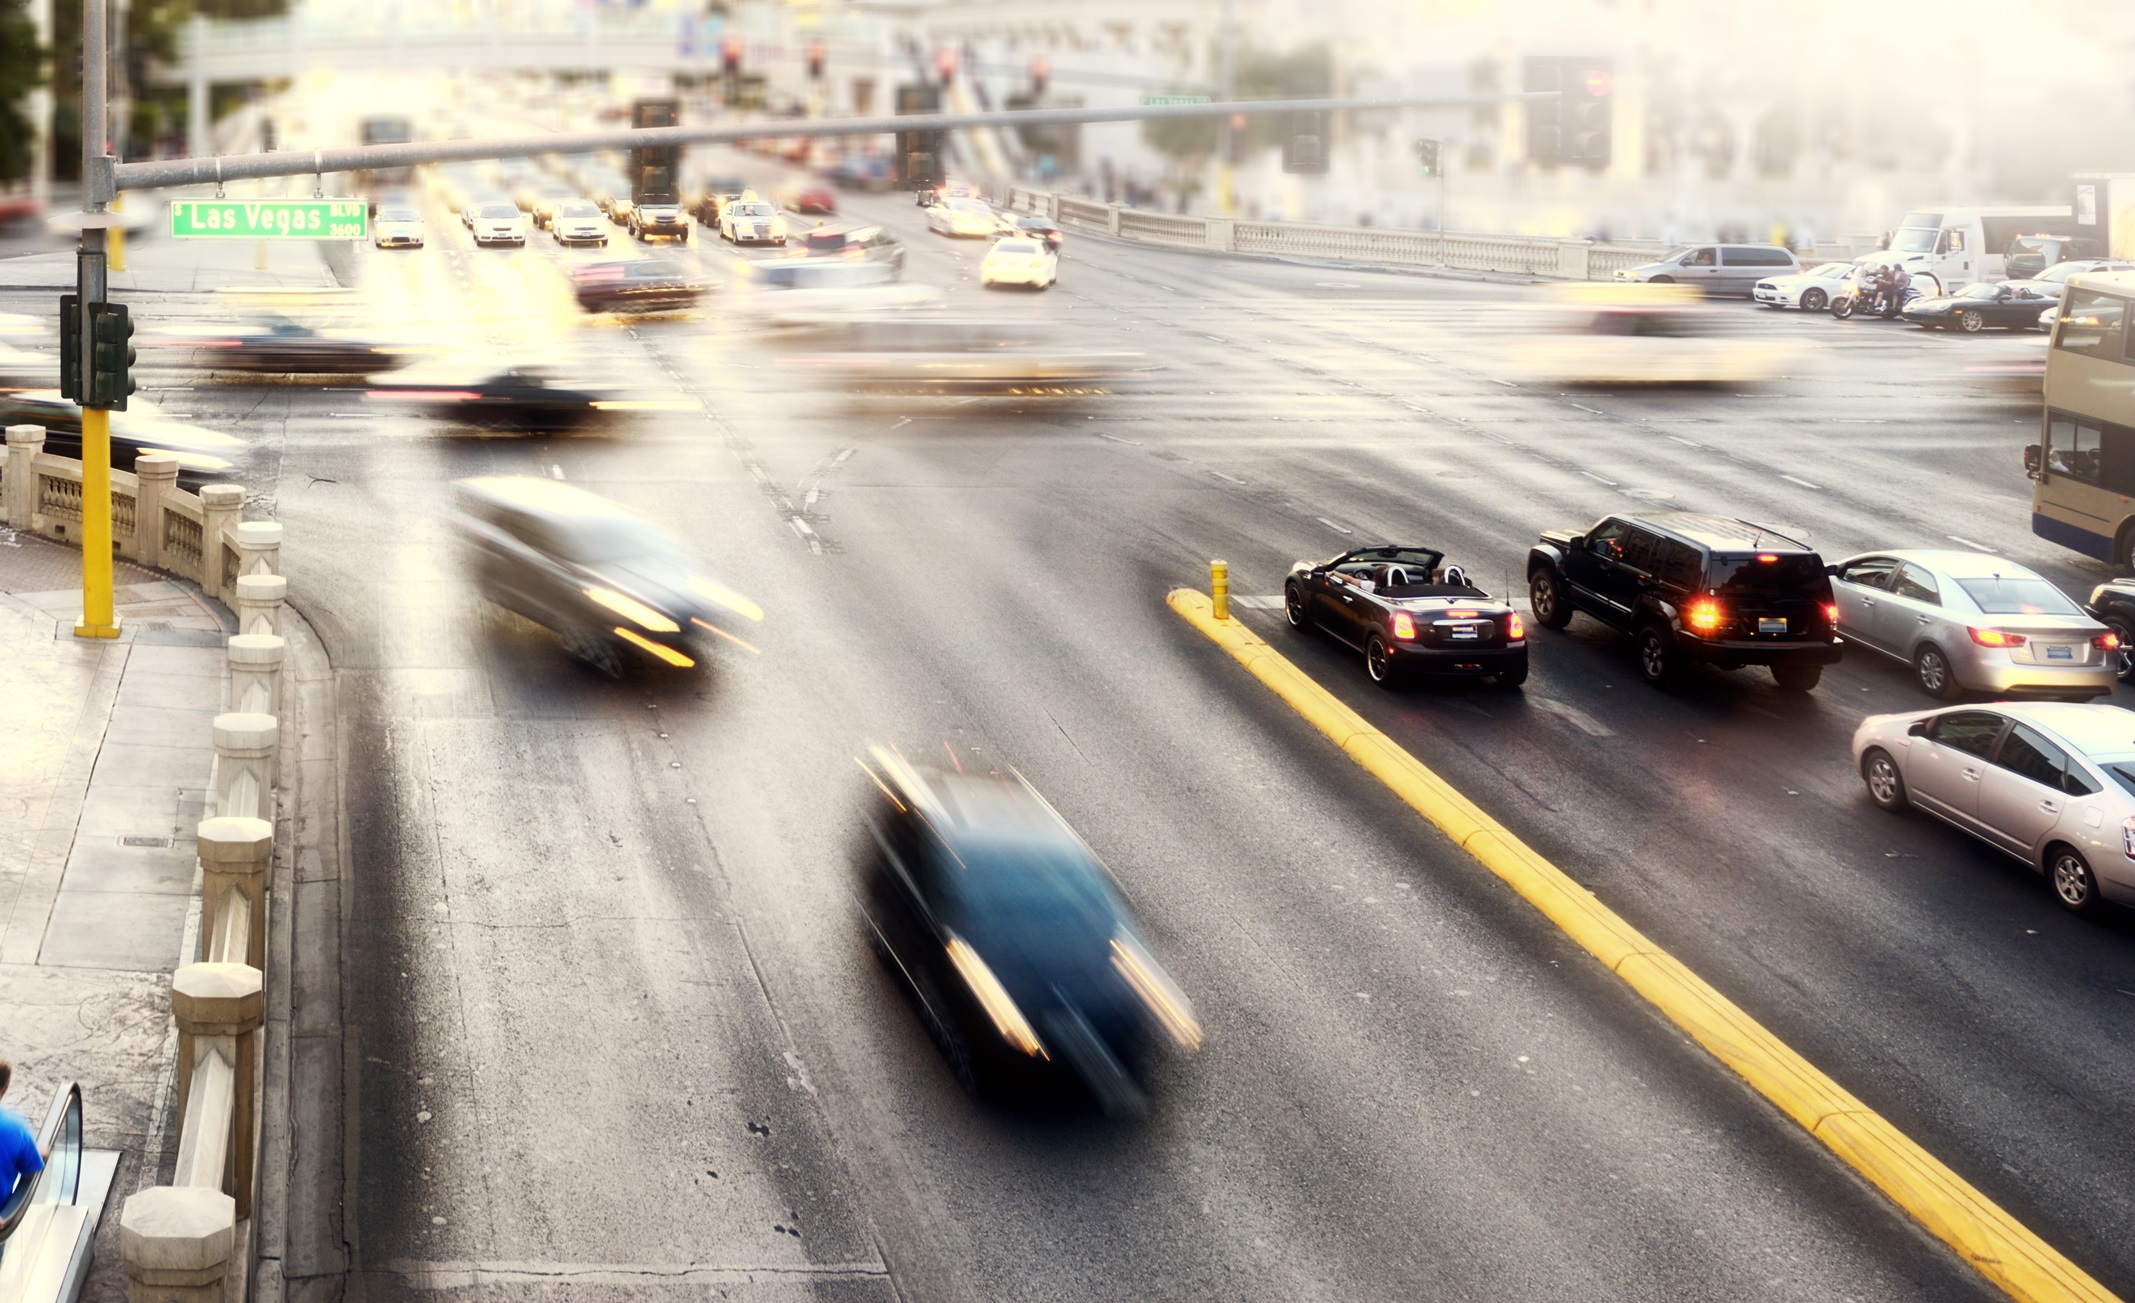
When investigating road collisions, analysts will look to identify the hotspots that have the highest concentration of incidents. Accessing transportation analytics, road safety authorities can see at a glance the intersections and roadways that are the highest priority for new safety measures.
Adding in a layer of traffic analytics coupled with historical collision data, authorities can start to understand where road repairs might be necessary, where a new road might need to be built altogether, or where building roundabouts might be necessary. It’s only when looking at accurate traffic data that patterns start to emerge, making it easier for analysts to pinpoint areas of concern and weigh out the possible solutions.
With access to traffic data insights and advanced data analytics, authorities can begin to paint a clearer picture of traffic volumes and dig into the factors that might be at play for a collision – like time of day or speed of the vehicle(s) involved. This could then lead to traffic management teams focusing safety measures during peak traffic hours where the likelihood of a collision is highest.
Vision Zero’s data states that 90 percent of pedestrians survive a collision with a car traveling at 20 mph, whereas only 10 percent survive if the vehicle is traveling at 40 mph. Lowering speed limits is often the first option when looking to improve pedestrian safety.
Equipped with an understanding of why collisions are occuring, planners can start to hone in on what preventative measures they can take. The solution might lie in updating street signs, increasing the number of lanes, implementing roundabouts and speed humps or switching up traffic light cycles. Any of these options greatly benefit from comprehensive traffic data in order to justify the proposed solution.
Data-driven road safety strategies
There have been many success stories to date across the US of cities using traffic data to implement Vision Zero strategies for increased road safety. Let’s look at a couple of them:
Portland, Oregon
As mentioned above, taming speed for safety has become a crucial element in the fight against road collisions. Portland, Oregon extended that lesson beyond just individual driving behavior and instead started to look at the impacts of appropriate speed limits.
In order to determine the role speed was playing, Portland identified a High Crash Network (HCN) that consisted of 30 high crash intersections and streets. The HCN represented only 8% of Portland streets, yet accounted for 57% of deadly crashes. When they started digging into the data to uncover why the collision rates were higher, they noticed a correlation with higher posted speed limits.
It might seem obvious that higher speed streets have higher collision rates, but it’s a fact too many cities continue to ignore. Now with the numbers to back up the analysis, Portland was able to move forward with a decision matrix on how to guide staff for implementing changes.
Strategies they’ve implemented include resetting speed limits in the HCN, maximizing technology in the form of safety cameras and redesigning roads to incorporate bike lanes or raised curbs. The Vision Zero Network believes that Portland’s approach to speed management aligns with a Safe Systems approach and offers a strong model for other communities.
Bellevue, Washington
After adopting a Vision Zero policy, Bellevue officials started to measure and analyze nearly 4,500 hours of video footage across 40 intersections in the region. After clocking more than eight million road users, they observed over 20,000 near-misses. Compiling that footage with other transportation data like bicycle counts and police incident reports, officials determined that cyclists were 10x more likely to be involved in a collision and that more than 10% of motorists were speeding.
Recently in 2021, Bellevue compiled their Vision Zero research and developed a Collision Dashboard to better understand the problem they’re dealing with and develop the right tools to address it. These data-driven analytics fueled budget allocation and policy proposals made by Bellevue related to biking and pedestrian infrastructure, as well as signage and other street improvements. The City allocated $2.5 million of its 2021-27 budget to implement rapid-build road safety projects along its highest injury network corridors. It’s these types of data-backed purchasing decisions that will move cities further along in meeting Vision Zero objectives.
Tackling speeding on busy neighborhood streets
Geotab ITS worked with New York City and their Office of Research, Implementation & Safety on a speed cushion evaluation project. Speed Cushions are rounded or flat-topped raised areas (similar to speed humps) placed across the road with wheel cutouts designed to allow large vehicles, such as fire trucks and buses, to pass with minimal slowing or rocking. Gathering speed analytics, NYC was able to prioritize traffic-calming interventions in particularly high-risk corridors around the city, particularly ones where other safety treatments were not feasible.
By comparing historical records around travel speeds pre-intervention, analysts could judge how effective their safety measures had been across these areas. Using data from the Altitude platform, the New York City Department of Transportation could determine that significant speed reductions did occur at speed cushion locations. This type of historical analysis coupled with near real-time, advanced speed analytics helps cities to know where to invest their efforts and resources for improving safety across their road networks.
Learn more about the RIS project with Geotab ITS Altitude data here.
Pre-Intervention at Brooklyn School Zone Sample – May 2019

Post Intervention at Brooklyn School Zone Sample – Dec 2021


Using Altitude data, NYCDOT can see that the school zones did see significant speed reductions, ranging from 2-9 mph depending on the location. This type of historical analysis coupled with near real-time, advanced speed analytics helps cities to know where to invest their efforts and resources for improving safety across their roads network.
Achieving Vision Zero will require a new outlook on how to utilize the most advanced traffic datasets available and by using connected vehicle data from Geotab ITS, the NYCDOT is taking strides forward.
Traffic fatalities in New York have fallen by a third since Vision Zero began, with an all-time low of 202 recorded back in 2018. The city is leading the charge internationally as an innovator in safe street design and a lot of that work is data-driven.
Building safer roads for communities of the future
Using these advances in technology and data-driven analytics, cities can be well-equipped to understand the traffic patterns and events happening on their roadways. This information fuels agencies to quickly address any sharp rise in incidents or collisions and allows them to develop more sound solutions that enhance road safety while not hindering traffic flow, which is often a concern for public officials and community leaders.
Now funding and road infrastructure changes are based on strong empirical data and can move Vision Zero goals forward while also planning for the future of an efficient community road network.
You might also be interested in
BLOG
What are contextual vehicle insights and why are they beneficial for transportation planners?
Discover why contextual vehicle insights are a must for transportation planners as they develop more effective policies and infrastructure.
BLOG
North Carolina and Florida hurricane use case: Using commercial vehicle data to understand the impact of extreme weather events
Learn how commercial vehicle data revealed the effects of extreme weather events on regional movement throughout North Carolina and Florida.

BLOG
Measuring the effects of a union strike on three critical U.S. ports using route analytics
Read to learn how route analytics from Altitude allowed us to study a union strike’s effects on critical ports in Savannah, New York, New Jersey and…